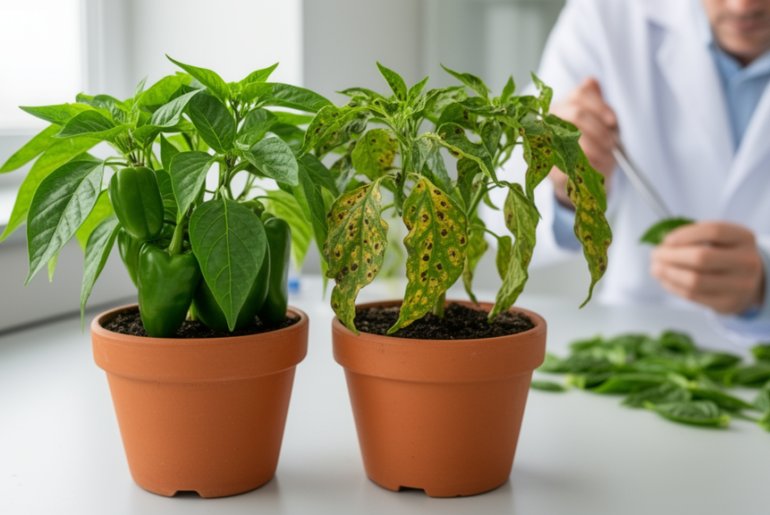

The proposed concatenation model for automatic early classification of pepper leaf and fruit rot diseases, including common rust leaves, blight leaves, gray leaves, fruit rot, healthy leaves, and healthy fruit is examined by experimentation in this section. The concatenation of the VGG-16 and AlexNet models at the training, validation, and test phases, as well as the performance metrics that were applied, were all implemented in a systematic manner. This included the dataset preparation, simulation tools, experimental results, and performance metrics. Table 1 provides a description of the architectural design parameters of the proposed concatenated CNN model employed in this study. Six convolutions are used in the model: one max-pooling, one global average polling, one batch normalization, one dropout, and one flatten layer. To avoid overfitting, a dropout layer is added below the global average pooling and dense layer.
Table 1 Description of the parameters of the architecture of the proposed concatenated CNN model.Simulation environment
The experimental prototype was developed using an Anaconda environment and the Python programming language from Keras, the back-end TensorFlow, and open-source libraries are needed to implement the pepper leaves and fruit rot disease classification models. We utilized the free Google Collaborators environment in accelerated GPU option mode to train the CNN model that combines the VGG16 and AlexNet architectures. With 64 batches, the model is trained over 100 epochs.
The designed prototype was tested on a Windows 7 Hp Pavilion laptop with 64-bit operating system. The laptop is an Intel(R) Core (TM) i5 with 2.30 GHz CPU processor, with 8 GB RAM and 700 GB hard disk capacity.
Experimental results before preprocessing of the proposed concatenated based CNN model
This was done to measure the performance of the proposed model before noise removal, segmentation of datasets, and augmentation, but the dataset size of 256 × 256 must be resized to 128 × 128 after which it is fed into the proposed model to achieve the training accuracy, validation accuracy, testing accuracy, loss, and performance of the models. As shown in Fig. 4, the performance of the proposed model is low. The reason is that the noise of images reduces the performance of the model.
Figure 4
Experimental result before preprocessing of the proposed concatenated CNN model.
Experimental results after noise removal for the proposed concatenated based CNN model
The filtering techniques used in the noise removal experiments are Gaussian filters. As a result, this noise reduction technique is used in the three models: VGG16, AlexNet-based CNN, and the proposed model after concatenation. When compared to the experiment one of Fig. 4, the noise removal method improve the performance of the concatenated model in the experiment. In the proposed concatenated model, noise removal was performed before image segmentation is performed. The result of the experiment is 89.18% training accuracy, 83.05% validation accuracy, and 79.07% testing accuracy, which increases some quantities as shown in Fig. 5. The concatenated models classification accuracy increases when the model is initially trained using the concatenation of two CNN-customized models: VGG-16 and AlexNet which require images of resolution, 128 × 128.
Figure 5
Experimental result after noise removal of the proposed concatenation based CNN model.
Experimental results after segmentation of the proposed concatenated based CNN model
We used the threshold method for segmenting our image datasets under threshold segmentation. We applied adaptive thresholding, which typically takes a Gaussian filter image as input and then produces a binary image representation of the segmentation. If the pixel value is lower than the threshold, it is set to the background value; otherwise, it assumes the foreground value. After applying adaptive segmentation, we tested the experiment’s result. When compared to Otsu segmentation, the experiment’s result for Otsu segmentation testing accuracy is 83.94%, but in testing the adaptive threshold segmentation method, we achieved 85.17%. After applying adaptive segmentation to convolutional neural networks, the most common graphical curves are the training phase and validation phase curves. Figure 6 shows that without segmentation there is large overfitting between the training accuracy of 97.34%, the validation accuracy of 86.05%, and the testing accuracy of 85.17%. The training and validation loss shows the misclassification of the training and validation accuracy of the concatenated models.
Figure 6
Experimental result after segmentation of the proposed concatenated based CNN model.
Comparison of the proposed concatenated-based CNN model’s testing performance
We compared before preprocessing, after noise removal, after segmentation, and after dataset augmentation to determine whether the proposed model’s performance has increased. The result is described in figure format as shown in Fig. 7. Additionally, deep learning can maximize the value of their input data by preprocessing and augmenting it, which enables the best outcomes to be attained even with high-quality data. As shown in Fig. 7, the testing stage of data preprocessing is one of the basic concepts for increasing the performance of our proposed model.
Figure 7
Comparison of testing performance of preprocessing of the proposed concatenated model.
Experimental result of training and validation accuracy curve after augmentation of the concatenated based CNN model
To achieve this, we concatenated by customizing feature extraction for VGG16 and AlexNet-based CNN. The proposed concatenated model is a good way of classifying the trained datasets when compared to the individual-proposed model. As shown in Fig. 8, the proposed concatenated CNN model uses mostly common graphical curves for training and its own curve for validation. In the models, the training and validation phases use 100 epochs, which greatly reduces overfitting, as shown in Fig. 8. The results show that the training accuracy is 100%, the validation accuracy is 97.29%, and the testing accuracy is 95.82%. Figure 8 shows that the model’s prediction on a given input is 0.26% off in training and 9.07% off in validation.
Figure 8
Training and validation accuracy curve after augmentation of the proposed concatenated based CNN model.
Experimental result of training and validation loss curve after augmentation of the proposed concatenated based CNN model
In the concatenations, the proposed models training and validation losses shown in Fig. 9 are predicted inaccurately. Loss indicates that these models incorrectly classified true data. That is, the figure is primarily a loss curve from top to bottom. The model’s prediction on a given input as inaccurately classified training accuracy loss is 0.26% and validation accuracy loss is 9.07%.
Figure 9
Training and validation loss curve after augmentation of the proposed concatenated CNN model.
Performance of confusion matrix and classification result for training after augmentation of the proposed concatenated based CNN model
The proposed models in the concatenations use data splits to achieve 70% training accuracy (2,235 images) across the total dataset. The training accuracy in the confusion matrix of the proposed models shows the right-to-left, vice versa, diagonal elements with the accurately classified positive rate prediction values without missing any blight images, leaving 383 out of 383 classified. That is, common rust (427 out of 427 correctly classified), healthy fruit (269 out of 274), fruit rot disease (463 out of 466), grey leaves (242 out of 249), and healthy leaves (435 out of 435) were all correctly classified. Furthermore, in the absence of a diagonal, all of the other elements shown in Fig. 10 are false predictions, implying that they are not incorrectly classified. The classification training report is a performance evaluation metric that displays the training accuracy of precision at 100%, recall at 100%, F1 score at 100%. A dataset of 2235 was used to support the training of the concatenated model, as shown in Fig. 10.
Figure 10
Confusion matrix of training after augmentation of the proposed concatenated CNN model.
Performance of confusion matrix for testing after augmentation of the proposed concatenated based CNN model
In the proposed concatenated model, the evaluation of the testing accuracy is a metric used after training and validation. In the confusion matrix, 15% (479 images) of the total datasets to test are made from right to left, and the diagonal elements that are positive rate accurately predicted values are displayed as 81, 91, 54, 97, 45, and 94, respectively, as shown in Fig. 11, but all other elements displayed outside of the diagonal are false rate which are inaccurately predicted. In the classification using the concatenated model, the accuracy of precision is 96%, recall is 96%, and F1 score is 96%, and the number of images in the dataset for testing is 479. Because the validation accuracy in these concatenation models is 97.28% and the testing accuracy is 95.82%, we conclude that the suggested concatenated model is superior than adapting VGG-16 and Alex Net’s models individually.
Figure 11
Confusion matrix of testing after augmentation of the proposed concatenated CNN model.
In Table 2, a comparative analysis of proposed concatenated CNN model with existing systems is presented. The results show that the proposed concatenated CNN model achieves a high accuracy as compared to the number of images processed and outperforms other methods in terms of processing time which it achieved in 2 min 20 s.
Table 2 Comparison of proposed concatenated CNN model with existing systems.