Analysis of variance showed significant differences (P ≤ 0.01) among the checks, test genotypes, between checks and test genotypes indicating substantial phenotypic diversity for plant architecture, fruit destemming, fruit morphology, and yield parameters in the C. annuum panel (CAP) (Supplementary Table S1). The maximum phenotypic diversity was observed for fruit destemming (DSFG (destemming force for green fruits) and DSFR (destemming force for red fruits) measured in Newtons N) followed by fruit morphology (PER; perimeter measured in cm and ARA; area measured in cm2). Yield parameters (TLY; total yield, GRN; green yield, RED; red yield, and PODWT; 10-pod weight measured in kg) were found to be the least variable traits. The coefficient of variation (CV) ranged between 9.37% (PHT; plant height measured in cm) and 52.37% (GRN; green yield). The average PHT (plant height), PWDT (plant width measured in cm), HTFPB (height to first primary branch measured in cm), DTFN (distance to first node measured in cm), and NBB (number of basal branches, count) were 41.7, 32.04, 16.79, 3.21, and 1.06 respectively (Table 1). The average destemming rating for green fruits (DSRG; 4.15) and destemming force for green fruits (DSFG; 52.18) were higher than destemming rating for red fruits (DSRR; 3.33) and destemming rating for red fruits (DSFR; 48.89). The average MAXW (maximum fruit width measured in cm) of the fruits was 3.18, whereas average MAXH (maximum fruit height measured in cm) was 10.02. Furthermore, the average curved height (CURH measured in cm; 10.58) of the fruits was higher than width mid height (WMH measured in cm; 2.06). The average contribution of green yield (GRN; 0.52 kg) to the total yield (TLY; 0.89 kg) was higher as compared to the red yield (RED; 0.39 kg).
Table 1 Summary statistics and genetic variability components of plant architecture, fruit morphology, fruit destemming, and yield parameters.Phenotypic diversity and heritability
The genotypic variance (σ2g) for plant architecture, fruit destemming, and fruit morphology was lower than the phenotypic variance (σ2p) (Table 1). The estimated genetic advances (GA) ranged between 0.19% (TLY) and 23.05% (DSFR). For plant architecture, PHT (10.35%) and HTFPB (5.94%) showed the highest GA, whereas DSFR and DSFG represented fruit destemming showed 23.05% and 17.25% GA, respectively (Table 1). For fruit morphology, GA was > 5.00% for all traits except WMH (1.79%) and MAXW (1.37%). Overall, the GAM ranged between 9.23% (DTFN) and 125.09% (PODWT).
Broad-sense heritability (H2) explained the overall contribution of the genetic effects to the expressions of the traits. The genetic effects were further dissected into additive variance (VA) and dominance variance (VD) to estimate the narrow-sense heritability (h2). Medium to high (≥ 0.40) values for h2 were observed for all traits except HTFPB (0.24), DTFN (0.22) and RED (0.07) (Table 2). Among plant architecture traits, PHT showed highest h2 (0.56) followed by PWDT (0.49) and NBB (0.47). The h2 ranged between 0.38 (DSRG) and 0.53 (DSFG) for the fruit destemming traits. Fruit morphology depicted the highest h2 (0.68–1.00) estimates as compared to plant architecture, fruit destemming, and yield parameters. Overall, additive genetic variance was higher compared to dominance variance for plant architecture, fruit destemming, fruit morphology, and yield related traits. A pattern was observed where traits with higher h2 exhibited higher GAM for plant architecture, fruit destemming, fruit morphology and yield parameters. The highest GAM was observed for PODWT (125.09%) and GRN (93.07%) with highest h2 (0.71 and 0.56) followed by WMH (GAM = 86.81% and h2 = 1.00), NBB (GAM = 81.66% and h2 = 0.47), and ARA (GAM = 77.01%, h2 = 0.68).
Table 2 Narrow-sense heritability estimates, additive genetic variance, and dominance genetic variance for plant architecture, fruit destemming, fruit morphology, and yield parameters.Genetic correlations and trait correlation network
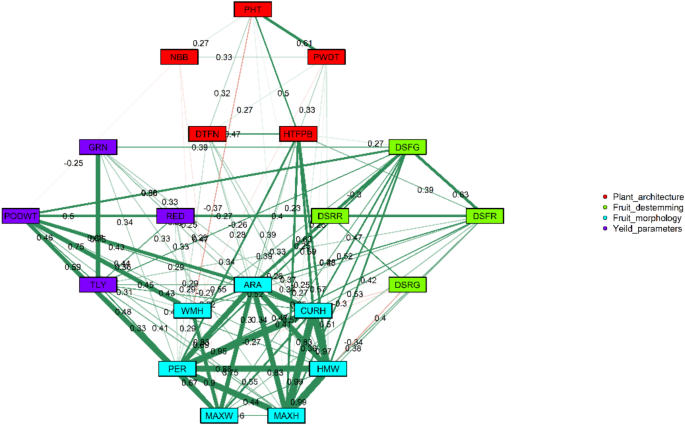
The Pearson correlation matrix depicted positive correlation for plant architecture, fruit destemming, fruit morphology, and yield related traits (Supplementary Table S2). Fruit morphology-related traits reported significant (P ≤ 0.01) Pearson correlation with values between 0.29 (WMH-PER) and 0.99 (MAXH-CURH; MAXH-HMW). Positive correlation coefficients (0.27–0.61) were observed for plant architecture except for DTFN which was negatively correlated (-0.13) with NBB. A strong positive correlation (0.47–0.63) was observed for destemming force (DSFR and DSFG) and destemming ratings (DSRR and DSRG); however, destemming force and destemming ratings were negatively correlated with each other. Destemming ratings (DSRR and DSRG) were negatively correlated with plant architecture traits except for HTFPB which showed positive correlation (0.39). Destemming force (DSFG and DSFR) also exhibited negative correlations with plant architecture. Fruit morphology (CURH, HMW, MAXH, MAXW, PER, and WMH) showed positive correlations with destemming ratings, ranging from 0.36 to 0.63, however it was negatively correlated with destemming force, with values between − 0.02 and − 0.34. Yield parameters (TLY, GRN, RED, and PODWT) were positively correlated with destemming ratings and fruit morphology, with correlation values ranging between 0.08 and 0.75; however, they were negatively correlated with plant architecture and destemming force. Correlation network was used to further illustrate the relationships among plant architecture, fruit destemming, fruit morphology, and yield parameters, considering the lowest positive significant correlation coefficient (0.23) (Fig. 1).
Fig. 1
Correlation network showing the relationships between plant architecture (PHT, plant height; PWDT, plant width; HTFPB, Height to first primary branch; DTFN, Distance to first node; NBB, number of basal branches), fruit destemming (DSRG, destemming rate for green fruits; DSRR, destemming rate for red fruits; DSFG, destemming force for green fruits; DSFR, destemming force for red fruits), fruit morphology (PER, Perimeter; ARA, Area; WMH, Width mid-height; MAXW, Maximum width; HMW, Height mid-width; MAXH, Maximum height; CURH; Curved height), and yield parameters (TLY, Total yield; GRN, mature green yield; RED, mature red yield; PODWT, 10-pod weight). The width of each band represents the strength of the correlation. Positive correlations are shown by green color bands, whereas negative correlations are displayed by red color bands.
Destemming force (DSF) and destemming rating (DSR) were calculated using the mean values of destemming rating (DSRG and DSRR) and destemming force (DSFG and DSFR) for red and green fruits, respectively, to estimate genetic correlations (rg) with plant architecture, fruit morphology, and yield parameters. Heatmap was further used to illustrate the relationships between destemming force and destemming ratings with plant height, plant width, number of basal branches, maximum fruit length, and maximum fruit width (Fig. 2). DSF exhibited negative genetic correlation coefficients with plant height (PHT; rg = -0.33), plant width (PWDT; rg = -0.28), and number of basal branches (NBB; rg = -0.67). In contrast, DSF showed positive genetic correlations with maximum fruit length (MAXH; rg = 0.28) and maximum fruit width (MAXW; rg = 0.70). DSR was positively correlated with NBB (rg = 0.06) and PWDT (rg = 0.04); however, it showed negative genetic correlation coefficients of -0.16 and − 0.10 with PHT and MAXW, respectively.
Fig. 2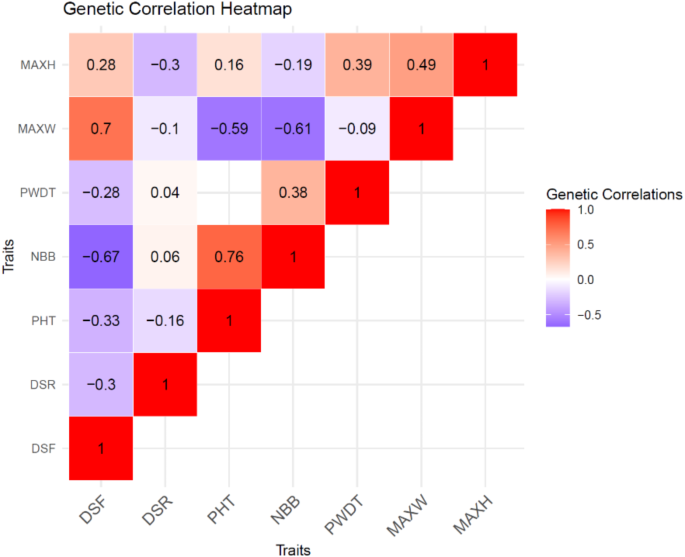
Genetic correlation (rg) heatmap showing the relationships between plant height (PHT), plant width (PWDT), number of basal branches (NBB), fruit destemming rate (DSR), destemming force (DSF), maximum fruit height (MAXH), and maximum fruit width (MAXW). Positive genetic correlations are shown in red color, whereas negative correlations are displayed in purple color.
Hierarchical cluster analysis
Hierarchical cluster analysis (HCA) was implemented for characterization of the CAP into different clusters based on plant architecture, fruit destemming, fruit morphology, and yield parameters. The Elbow method reported eight optimal clusters as represented by distinct inflection points (Fig. 3). Clustering using the Elbow method achieved a balance between compactness within clusters and clear separation between them by minimizing within-cluster variance while avoiding an excessive number of clusters that could lead to overfitting. Clusters 1 (CLU1), CLU5, and CLU7 had the highest number of genotypes, each comprised of 16 genotypes; followed by CLU3, CLU4 and CLU6 with 8, 7, and 6 genotypes, respectively (Fig. 4). The lowest number of genotypes appeared in CLU2 and CLU8, each consisting of 4 genotypes. Cluster means and population mean were used to assess the differences between the clusters and deviation from the population mean for plant architecture, fruit destemming, fruit morphology, and yield parameters (Table 3).
Fig. 3
Identification of the optimal number of clusters using the elbow method.
Fig. 4
Hierarchical cluster analysis–derived dendrogram demonstrating eight clusters based on plant architecture, fruit destemming, fruit morphology and yield parameters.
Table 3 Cluster means and population means for plant architecture, fruit destemming, fruit morphology and yield parameters.
The destemming rating (DSR) and destemming force (DSF) were further divided into three categories: ‘Excellent’ (DSR ≤ 2); ‘Good’ (DSR (2 < DSR ≤ 3), and ‘Unacceptable’ (DSR > 3). For DSF, the following classifications were used: “Low destemming force” (DSF ≤ 40 N); “Medium destemming force” (40 < DSF ≤ 60 N), and “High destemming force” (DSF > 60 N). The trait values are the means of the individual genotypes within that specific cluster. Clusters (CLU) 1, CLU3, CLU5, and CLU8 displayed high DSF (> 60 N) and DSR (> 3) which classify them as “unacceptable” for destemming and were excluded from further evaluation. Clusters with low to medium destemming force and low destemming ratings were identified as suitable for mechanical harvesting. The lowest destemming force for green fruits (DSFG = 36.16 N) and red fruits (DSFR = 31.74 N) were reported for CLU7, whereas destemming force was higher for CLU2 (DSFG = 56.05 N and DSFR = 47.68 N), CLU6 (DSFG = 53.05 N and DSFR = 40.49 N) and CLU8 (DSFG = 62.35 N and DSFR = 62.29 N). Notably, CLU7 demonstrated low destemming force and high destemming ratings (DSRG = 4.86 and DSRR = 3.95), indicating that fruit breakage occurred under lower destemming forces.
CLU2 (DSRG = 2.88 and DSRR = 2.48) and CLU6 (DSRG = 3.32 and DSRR = 2.20) were classified as “good” for destemming despite both clusters reporting higher destemming forces compared to CLU7. In addition to fruit destemming traits, plant architecture is also critical for machine driven harvesting in chile peppers. CLU4 reported taller genotypes (PHT = 48.98 cm) with greater height to first primary branch (HTFPB = 20.76 cm) and fewer basal branches (NBB = 1.08). This cluster excelled in fruit morphology where it reported longer (MAXH = 11.39 cm and CURH = 12.04 cm) and wider fruits (MAXW = 3.50 cm) with higher fruit perimeter (30.46 cm) making it higher yielding (TLY = 0.50 kg). However, this cluster was classified as “unacceptable” for destemming due to high destemming ratings (> 3) even at medium destemming force (> 40 and ≤ 60 N). The fruit morphology for CLU7 was similar to CLU4, however, plant architecture and destemming parameters deviated from traits needed for machine-driven harvesting.
CLU2 exhibited taller plants (PHT = 45.33 cm), fewer basal branches (NBB = 2.33), higher height to first primary branch (16.76 cm) combined with medium destemming force (> 40 and ≤ 60 N) and low destemming ratings (< 3) which perfectly aligned to the machine-driven plant ideotype. The fruit morphology (MAXH = 11.12 cm, CURH = 11.65 cm, MAXW = 2.94 cm, and PER = 28.34 cm) of CLU2 was similar to that of CLU4 and CLU7. However, CLU2 showed higher total yield (TLY = 1.09 kg), indicating not only higher genetic potential for yield parameters (RED and GRN) but also in alignment with the New Mexican pod type.
Fruit morphology of CLU6 and CLU8 deviates from a typical New Mexican pod types as they reported the lowest fruit length (< 7 cm), and fruit width (< 3 cm) as compared to other clusters. Both clusters comparatively reported shorter plants, lower height to first primary branch combined with high destemming ratings (> 3) and high destemming force (> 60 N) making them unfit for mechanized harvesting. CLU2 was found to be more associated with machine-driven traits that showed mean values exceeding the population means for plant height (PHT), plant width (PWDT), height to the first primary branch (HTFPB), maximum fruit length (MAXH), curved fruit length (CURH), maximum fruit width (MAXW), total yield (TLY), and green yield (GRN). CLU2 also reported the lowest means for destemming ratings (DSRG and DSRR), although the population mean did not differ significantly from the CLU2 for destemming force (DSFG and DSFR). On the contrary, CLU1, CLU3, CLU4 and CLU5 exhibited higher mean values for destemming ratings (DSRG and DSRR) compared to the population means making them less suitable for mechanical harvesting though they showed higher mean values for plant architecture (PHT, HTFPB, NBB) and fruit morphology (MAXH, CURH, MAXW).
Principal components analysis
PCA analysis was conducted to identify the linear combinations of plant architecture, fruit morphology, fruit destemming, and yield related traits that contributed to the overall phenotypic diversity observed in CAP. The PCA revealed that 75% of the variability was explained by the first five principal components (Supplementary Fig. S1 and Table 4). The PC1 and PC2 accounted for 37.40% and 15.27% of the total variation, respectively. PC1 showed positive eigenvector values for most traits, ranging from 0.07 to 0.34, except for NBB (-0.07), DSRG (-0.11), and DSRR (-0.08), indicating stronger positive association of fruit morphology, fruit destemming and yield -related traits with PC1. In contrast, the eigenvector values for PC2 were higher for plant architecture traits, ranging between 0.20 and 0.43, suggesting that PC2 explained more phenotypic diversity related to plant architecture. Angles ≤ 90° between eigenvectors indicated positive correlations, with lower angles among fruit morphology, plant architecture, destemming force, and yield-related traits, suggesting strong positive correlations (Fig. 5). In contrast, destemming ratings had obtuse angles (> 90°) with all other traits, indicating negative correlations. These observations were consistent with our results from Pearson correlation and genetic correlation analyses for plant architecture, fruit morphology, fruit destemming, and yield-related traits.
Fig. 5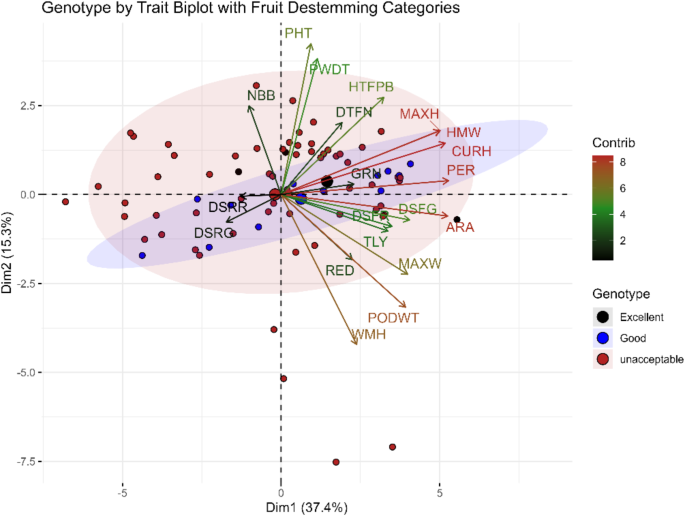
Genotype by trait biplot displaying traits contributing towards principal components PC1 (Dim1) and PC2 (Dim2) and relationships of genotypes with response variables. Black (> 3), blue (≤ 2), and red (> 2 and ≤ 3) dots represents genotypes with destemming ratings. Color intensities and lengths of the arrows represent the contribution of the traits to the first two principal components. Dark red color and longer arrows indicate a higher contribution of the response variables. PHT, plant height; PWDT, plant width; HTFPB, Height to first primary branch; DTFN, Distance to first node; NBB, number of basal branches; DSRG, destemming rate for green fruits; DSRR, destemming rate for red fruits; DSFG, destemming force for green fruits; DSFR, destemming force for red fruits; PER, Perimeter; ARA, Area; WMH, Width mid-height; MAXW, Maximum width; HMW, Height mid-width; MAXH, Maximum height; CURH; Curved height; TLY, Total yield; GRN, mature green yield; RED, mature red yield; PODWT, 10-pod weight.
Table 4 Principal component analysis of plant architecture, fruit destemming, fruit morphology and yield parameters: PCA descriptor trait contribution, correlation coefficient (R2), eigenvector, and eigenvalues for principal components 1 (PC1), 2 (PC2), and 3 (PC3).
Genotype-by-trait biplot with ellipses for ‘Excellent’, ‘Good’, and ‘Unacceptable’ categories for mechanical harvesting further illustrated the relationships among the mechanical harvestability and agronomic traits. Each ellipse represented a unique category of genotypes (i.e., ‘Excellent’, ‘Good’, and ‘Unacceptable’) based on the fruit destemming ratings. However, overlapping of genotypes among ellipses was anticipated due to the diversity of the CAP. The ‘Excellent’ category ellipse was not shown on the biplot due to insufficient number of points to calculate it. Genotypes located near the origin of the biplot were closer to the population means, whereas those positioned away from the origin, near any specific eigenvector showed distinctive association with that particular trait. Many of the genotypes displayed as ‘red dots’ on the biplot were positioned away from destemming ratings (DSFR and DSFG) and destemming force (DSFR and DSFR) eigenvectors, indicating their poor performance for mechanical harvesting. No distinct cluster of genotypes (red dots on the biplot) was observed for ‘Unacceptable’ and ‘Good’ category ellipses. Both ellipses overlapped sharing several genotypes indicated the genetic diversity within the CAP for traits critical to mechanization. Genotypes belonging to Clusters 5 and 6 from the HCA appeared under ‘Good’ category ellipse, positioned near the DSRR and DSRG eigenvectors, indicating their suitability for mechanical harvesting. Some of the genotypes from both clusters were also positioned closer to fruit length (MAXH) and fruit width (MAXW) eigenvectors representing New Mexican pod-type genotypes with traits amenable for mechanical harvesting.
Contour analysis of fruit destemming patterns in clusters 2 and 6
Contour analysis was performed for Clusters 2 and 6 to complement the information derived from Pearson correlation which only considers the relationship between two variables. For the mechanization of New Mexican pod type peppers, it is important to study the trends of fruit destemming ratings at different levels of fruit destemming force in relation to plant architecture and fruit morphology. Fruit destemming force and ratings were analyzed in relation to plant architecture and fruit morphology using separate contour plots (Supplementary Fig. S2A–D). These plots displayed relationships of destemming traits (force and rating) with height to first primary branch, number of basal branches, fruit length and fruit width for cluster 6 and 7. Color gradient in the contour plots displayed destemming force whereas destemming rating on the x-axis and plant architecture and fruit morphology on the y-axis (Supplementary Fig. S2A–D). The fruit length (MAXH) was recorded between 8.00 and 12.00 cm with destemming force (DSFG) ranging between 44.00 and 52.00 N with acceptable ratings (< 3). The lowest destemming force (44.00–46.00 N) was associated with smaller fruit length (< 8.00 cm) whereas fruit length gradually increased with an increase in the destemming force (Supplementary Fig. 2A). A similar trend was observed for fruit width (MAXW) where destemming force displayed an increase with the increase in fruit width while maintaining acceptable fruit destemming ratings (Supplementary Fig. S2B). The lowest destemming force (44.00 N) was associated with fruit width ranging between 2.00 and 2.50 cm.
A region on the contour plot was observed with the lowest destemming force ranging between 44.00 and 46.00 N displayed a lower number of basal branches ranging between 1.50 and 2.00 with acceptable fruit destemming ratings (Supplementary Fig. S2C). Notably, the number of basal branches did not increase with an increasing destemming force. Height to the first primary branch > 17.00 cm was observed for fruit destemming force ranging between 48.00 and 50.00 N with unacceptable destemming rating > 3 (Supplementary Fig. S2D). Overall, as the destemming force increased, the height to the first primary branch also increased. However, genotypes with high destemming force and height to the first primary branch did not have acceptable fruit destemming ratings (> 3).